

Do you ask yourself, What font should I use for eLearning? Here are the most important factors for how to choose a font for eLearning.
Methods for Capturing SME Knowledge

Lots of ways to capture the knowledge and know-how when working with SMEs for instructional design projects.
How To Use Dingbats For Free eLearning Illustrations

Dingbats are fonts that consist of little pictures. When you enlarge them, you can use them as free illustrations. Here’s how.
A Graphic Development Workflow For eLearning
Having an efficient graphic development workflow for eLearning saves you time and effort during production and when locating older graphics.
How To Set Up Your Authoring Tool Workflow
This Process Should Work With Any Authoring Tool
If you’re looking for an authoring tool workflow, consider the approach outlined here. It’s efficient and helps you stay productive.
10 Visual Design Tips For eLearning And Slides

If your goal is to get better at visual design, you don’t need to be a talented artist. You just need to learn and apply the foundation principles of visual design and practice, practice, practice. In this SlideShare presentation below, I’ve gathered up ten important principles and little tips from my book, Visual Design Solutions. […]
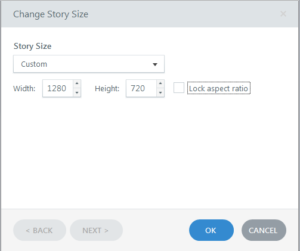
Three Things You Must Know When Working With Graphics
Answers to Graphic Questions You Were Afraid to Ask

Learn about the technical side of graphics including sizing, resolution, vectors and bitmaps.
How to Create a Magnification Graphic
Magnify One Part to Show Detail

Five steps to creating a visual that magnifies one part of an object in order to show the detail needed to facilitate learning.
Visualizing Timelines For Learning
You can visualize timelines for a variety of facts and concepts. Here are examples that demonstrate how to use timelines for learning.
Using Ribbons, Stickers and Tags In eLearning Design
How to use ribbons, stickers and tags to add some flair to your eLearning designs.
eLearning Photography: How To Get The Best Shot

Do you have doubts about your photography skills? Get a makeover right here.
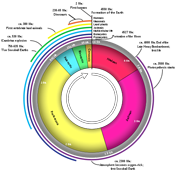
Visualizing Data For Learning Experiences
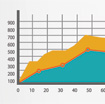
Visualizing information makes it tangible so that people are more likely to comprehend it. Here are four compelling examples.