
If you work with technical or scientific content, then you know the content you present is often not visible to the naked eye. We’re talking about microbes, machine components, hidden aspects of nature and so on.
When you magnify one part of a graphic, you can facilitate learning. You can show the details of one part of an object in the context of the whole object.
Show Context
If you can get your hands on a magnified visual, such as through an illustration or an extreme close-up photo, and a normal big picture view, it’s easy to merge the two graphics so that the enlarged view is placed in context.
Context is very important in visual learning, as viewers gather many clues from the surrounding region of a picture to increase their understanding. So using two photos or illustrations together (magnified view and regular normal view) is better than the enlarged view alone.
Five Steps to Creating Your Graphic
I created one of these the other day for a medical client and thought I’d share the process. It can be done quite quickly—in five fairly easy steps. Although I used Photoshop, you can use free image editors like Gimp or Aviary. (See my list of Image Editing Tools.) Also, you can achieve most of these steps in PowerPoint.
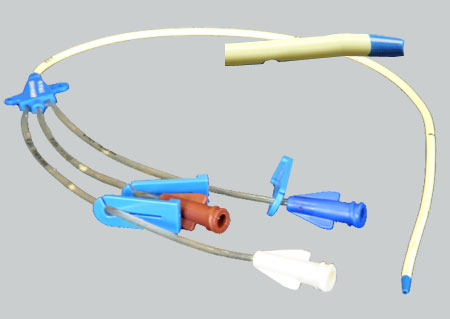
STEP 1. Collect your two photos or illustrations. I had two photos of catheters—a close-up photo of the catheter tip from the client (below left) and a photo of the entire catheter taken at one of those glamorous workplace photo shoots (below right). For this learning situation, it was important for learners to see the tip of the catheter, so I wanted to merge the photos below.

Step 1. Start with two images, the magnified and the big picture.
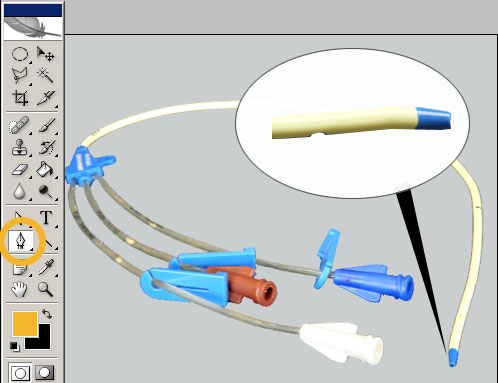
STEP 2. First I cut out the catheter from the blue background so the background to the enlarged photo would be transparent. In PhotoShop, you can use the Magic Wand tool, the eraser or the Lasso tool. I cut it out with the Magic Wand and the smoothed the edges with the eraser.

Step 2. Cutting away the dark background with PhotoShop’s Magic Wand tool
STEP 3. Next, place the enlarged object on a layer above the big picture photo. You have to find a place where nothing important will be covered. That’s why I chose the upper right.
Step 3. Place enlarged image into the big picture image
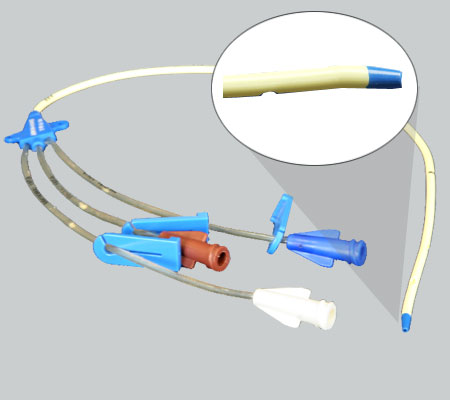
STEP 4. Use a shape tool to draw an inset box or circle behind the enlarged object. In this case, the constraints of the image and shape of the enlargement forced me to use an ellipse. A rectangle probably would have worked, but for enlargements, circles might be more conventional because we associate that shape with a magnifying glass. You may also want to outline the shape so it stands out against the background. In terms of visual hierarchy, this magnified region is important.

Step 4. Draw an inset box or circle behind the enlarged object
STEP 5. To help learners make the cognitive connection, draw a shape that will indicate what the enlarged object is magnifying. In this case, I drew a narrow triangle with the pen tool to avoid covering anything. An alternative to this approach is shown at the end.
Step 5. Draw a connection from the enlarged area to the location of what it magnifies
The connector could also be a line or a wide cone as shown below. To avoid obstructing anything important in the image, make the cone partially transparent. Which approach do you think is best? The one I used above or the alternative below?
An alternative connector: the transparent cone
So that’s it. You can see how in many learning situations, an enlarged graphic placed in context can help a learner construct a better idea of how something is structured or how it operates.
Get the latest articles, resources and freebies once a month
plus a Visual Design Cheat Sheet.
Leave a Reply