
The Picture Superiority Effect
Although visuals are not always superior to words, the phenomenon known as the picture superiority effect demonstrates that graphics do improve learning in many contexts and with many audience groups. The picture superiority effect states that people generally have a better memory for pictures than for corresponding words. That is, pictures are more memorable than their verbal counterparts. Interestingly, the magnitude of the picture superiority effect increases with age.
Graphics enhance many aspects of learning including recognition, recall, comprehension and problem-solving. As instructional designers, we can keep the picture superiority effect in mind and use visuals strategically. Keep in mind that both words and pictures are often best when it comes to learning design. Here are some ways you can use pictures to improve learning.
Portray Emotions in Stories

When you use a scenario approach to learning, use photographs or illustrations to ensure the audience gets the message. Showing the characters as they experience an event adds emotional depth.
Surprisingly, a voice over can work well with still photos if you don’t have the budget for video. Ideally, you can pan the photo (move horizontally across it) or zoom in or out of the photo to add a sense of action.
Visualize Data as a Cognitive Aid
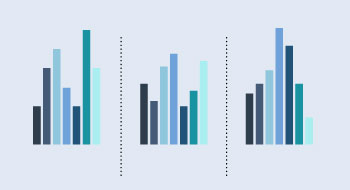
Diagrams and graphs help learners comprehend large sets of data using visual language to depict meaning. For example, it’s easier to make comparisons when looking at a bar chart than when looking at raw numbers. In diagrams the connecting lines between elements help learners understand relationships. Line graphs help learners understand trends.
In several studies, researchers were able to influence people to reduce risk-avoidant behavior by displaying the risk reduction graphically rather than numerically.
Make abstract information concrete with a corresponding visual when possible. See Which graphic should I use for eLearning? for additional examples of graphs and charts.
Identify Parts and Components
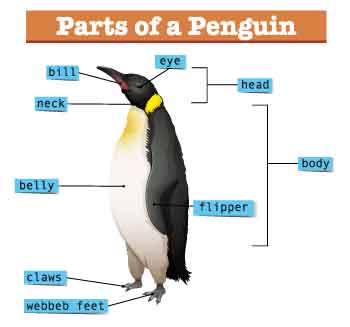
Use labeled illustrations when a learner needs to know the specific parts of an object. This is particularly useful when there are many components, such as in anatomical or mechanical illustrations and diagrams.
Another use is showing a cutaway into the object when the parts are hidden, microscopic or invisible. You may need to hire a contract illustrator to create this type of graphic. It’s also possible to easily create a magnification graphic—even with a photograph—and then label the parts.
Trace the Motion and Path of an Object

Visuals are a potent way to show the movement of an object or person. You can depict motion along a curvy or straight line, as in this graphic that shows the path of Hurricane Katrina.
Use visual language to indicate additional information in the line. For example, a thick line might indicate strength. A dotted line might indicate a proposed path or one that wasn’t taken. In this example, colored circles on the line correspond to a key showing the strength of the hurricane.
You can also depict motion with curved arrows, such as showing the moving parts of a machine. Wavy arrows can also depict movement, such as evaporation in the water cycle.
Photo courtesy of NOAA, Office for Coastal Management, DigitalCoast
Envision Metaphors and Analogies

In instructional design, it is helpful to use a metaphor or analogy to explain something unfamiliar by comparing it with a familiar object or idea. Metaphors offer an excellent opportunity for using visuals, because they work well as mnemonic devices—helping learners to remember new information. Read about how to write analogies to enhance learning.
Represent Geography and Statistical Data
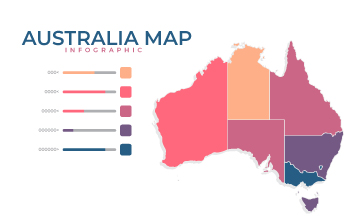
Maps are ideal for helping learners understand location and geography, but they can be used for more than this.
Consider using statistical maps to show quantitative information. Statistical maps show the distribution of a variable as it relates to location. For example, you can use this type of diagram to show population, crime rates, cell phone use or political affiliations. Learners quickly perceive and understand map information because they are a conventional type of graphic.
Show Physical Objects

Perhaps the most obvious use of visuals is to show a concrete and familiar object. The addition of a graphic for an already known object may not enhance learning in a direct way.
However, pictures provide an aesthetic appeal that can improve motivation. The example on the right shows an appealing illustration for a lesson on healthy eating. What makes it appealing? It’s colorful, dynamic and aesthetically pleasing. Just be careful that your unnecessary graphics are not so extravagant that they detract from the learning message.
References:
Defeyter, MA, Russo, R, & McPartlin, PL. The picture superiority effect in recognition memory: A developmental study using the response signal procedure, Cognitive Development, Volume 24, Issue 3, 2009, 265-273.
Schirillo JA & Stone ER. The greater ability of graphical versus numerical displays to increase risk avoidance involves a common mechanism. Risk Anal. 2005 Jun;25(3):555-66.
Terry L. Childers, Michael J. Houston, Conditions for a Picture-Superiority Effect on Consumer Memory, Journal of Consumer Research, Volume 11, Issue 2, September 1984, Pages 643–654.

Excellent way of explaining, and good article to obtain information concerning my presentation focus, which i am
going to deliver in university.
Thank you, Harry.
Using a great deal of research work I wish too bring to your notice that Graphic communication is also a means of comprehending thought. It has yet been the case that thought is that protected domain of what we describe as Mind and cannot be unrevealed as such. My work with secondary and tertiary students has indicated that when a visibility is induced in two levels of thinking either through graphical means or a model we can obtain some comfort that its reveals the two levels of thought. My system is called Psychartechnology. Regards.
What you’re in need of is a little vague to me, but it you look through all the graphics articles on this site, you might find something. Processing fluency and picture superiority come to mind. Good luck!
Connie
I’m working on use of graphics to improve learning, a m.ed instryctional technology student. Ahmadu Bello University, Zaria, Nigeria. i’m in need of few theories as relate to instructional graphics and design to incooparate in a literature review in the project report.
Thank you.
I didn’t know these techniques. It seems interesting. I have always used mnemonic devices to learn and remember things, but not in this way. I have used them since I was a child. They are good advices.
Regards,
John creator of Mnemonic Devices – The Revision Guy, the blog to learn using mnemonic devices.
Hi Ben,
Yes, it does seem that simple at times, doesn’t it?
Connie
Great tips! So often the problem in teaching or learning boils down to: “what are we talking about?”
I also like maps, thanks to maps everything is easier to understand and memorize.