
When the importance of visualization became popularized, an explosion of books were published for those who were hungry to understand and appreciate this graphic format. It was an obvious win for practitioners who were trying to improve communication and understanding. These books also served as inspiration for people who were needed visual ideas on demand, like instructional designers.
So that we don’t lose the value of these older books, I’m republishing this article listing ten compelling books from the early days of visualization: 2006 to 2012. The one exception, is Tufte’s book from 1990. I recommend these books for visual examples and for inspiring ways to visualize concepts, statistics and data. They are also a part of our graphic design history.
The list is organized into two categories. Books that feature explanatory graphics and those that portray information graphics and visualizations.
Explanatory Graphics
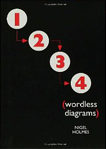 1. Wordless Diagrams by Nigel Holmes
This small book of wordless illustrations is brilliant and fun. It contains the wonderful explanatory visuals of Nigel Holmes, previous graphic director of Time Magazine. You might be surprised and inspired to see all the things he’s been able to explain visually. For example: How to Conduct; How to Curtsy; How to Carve a Pumpkin; How to Test Wine.
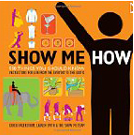 by Lauren Smith and Derek Fagerstrom
Show Me How achieves something that learning professionals are often seeking—an effective visual approach for teaching “how to” skills. It’s brimming with visual ways to portray a seemingly endless number of actions (500 to be exact), from decorating eggs to dancing a steamy tango.
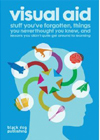 3. Visual Aid: Stuff You’ve Forgotten, Things You Never Thought You Knew, and Lessons You Didn’t Quite Get Around to Learning by Draught Associates
Visual Aid illustrates many common knowledge gaps people have using varied graphical explanations. The book isn’t organized as a reference. But it could be useful for anyone seeking ways to expand their visual ideas.
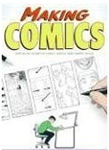 4. Making Comics by Scott McCloud
Scott McCloud is the hero of explaining things through the comic art form. If you want to improve your skills at conceiving or creating comic-style stories, he’s the one to read. Making Comics goes beyond illustration techniques, delving into storytelling and communication skills. His book covers all you need in order to “write with pictures.”
Information Graphics and Visualizations
 5. Envisioning Information by Edward Tufte
In this classic, Tufte writes eloquently and academically about how to present visual information. The examples are subdued and often historical. A few chapter titles: Escaping Flatland; Layering and Separation; Small Multiples; Color and Information. You’ll find lots of visual ideas here, but they are more difficult to replicate. The publication date is 1990.
 6. Show Me The Numbers: Designing Tables and Graphs to Enlighten by Stephen Few
Stephen Few excels at visual business communication. In this book, he provides guidelines for delivering information and data in tables and graphs. After discussing those basic statistical definitions, he focuses on visualizing for the real world, providing lots of sound design practices. Also see: How to Make Numbers Interesting.
 7. Visual Language For Designers: Principles for Creating Graphics That People Understand by Connie Malamed
I had to include my own book, right? In Visual Language For Designers, I present principles of visual communication design based on cognitive science research, rather than intuition. This book is geared toward all visual communicators, including instructional designers. Designers and illustrators from around the world contributed over 250 graphics to the book.
 8. Data Flow: Visualizing Information in Graphic Design by R. Klanten, N. Bourquin, S. Ehmann and F. van Heerden.
Data Flow is a collection of visualizations showing off the many possibilities for depicting data. It focuses more on examples than it does on explanations. The book provides a rich browsing experience in you need inspiration.
 9. The Wall Street Journal Guide to Information Graphics by Dona M. Wong
The WSJ Guide covers much of the basic information that beginners need to conceive and create information graphics. The title may be misleading. Wong takes you way beyond financial graphics into representations of all types of data. There is no way to look inside the book, but some of the pages are available as images.
 10. Information is Beautiful by David McCandless
In this classic information graphics book, McCandless transforms facts, statistics, issues, theories, relationships, numbers and words into beautiful diagrams, charts and visualizations. You’ll find lots of ideas in this one. For more on information visualization, listen to my interview (or download the transcript) with Alberto Cairo, professor and information visualization designer.
Get the latest articles, resources and freebies once a month
plus a Visual Design Cheat Sheet
.

I wondered who bought them. Thanks Laura 🙂 and I hope you find them helpful.
Connie
Thank you Connie! I bought both of your books: 1)Visual Language for ?Designers and 2) Visual Design Solutions. Almost done with both and trying to apply where ci can for software training.
Appreciate your newsletter.