
 In the not so distant past, data visualization was reserved for the scientific community. It helped researchers grasp the structure and relationships in large sets of data. But the explosion of complex information in most knowledge domains has changed all that.
The appreciation for visual thinking is growing and you can find many data visualizations in the popular media. Are we doing as much as we can to visualize information when we design learning experiences?
When information is visualized, it becomes tangible, which facilitates understanding. If you’re looking for new ways to visually explain complex and abstract concepts, I’ve found that it helps to play around with data visualizations. Here are four compelling examples where you might find inspiration. The last three are highly interactive.
 Explaining 1 Trillion Dollars
Although it might be difficult to understand 1 trillion dollars, the BBC found a simple way to explain this numeric concept. It starts with a door mat as one unit and expands from there. Analogies like this are ideal for explaining complex numerical concepts. To see this visual in action, click on the But how big is that? button and then on each number category. It takes a minute for the whole thing to load. See 1 Trillion Explained.
 How Different Groups Spend Their Day
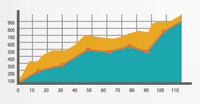
The New York Times excels in interactive data visualizations. They have the staff and the vision to create interactive graphics that help you see information in new ways and to draw your own conclusions. This particular example may reveal much about the culture and society of the US. In terms of online learning, you get a lot here just by playing around. That alone is a powerful design lesson for all of us. See How Different Groups Spend Their Day.
 Health Infoscape
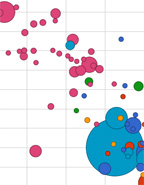
This visualization describes a disease network and the correlation between conditions. The health conditions can be viewed by gender and in two different layouts. You can select diseases and condition from a list of categories and then roll-over each circle for the specifics. Notice how changing the layout changes how you perceive the relationship of the information. See Health Infoscape.
 Create Your Own Visualizations
Google Public Data Explorer provides access to tools and databases for visualizing the world’s economies, societies, health and much more. Here you can visualize very large public data sets. These visualization tools offer a variety of modes for viewing data and give you opportunities for creating your own visualizations. Play with Public Data Explorer.
Related Article:
For more on visual thinking, see my review of The Back of the Napkin as well as my book, Visual Language For Designers.
How would you use data visualization in courses you design? Comment below.
Keep up with your field! Get The eLearning Coach delivered to your Inbox every month, with ideas, articles, freebies and resources.
Social comments and analytics for this post…
This post was mentioned on Twitter by elearningPosts: Learning From Visual Data http://dlvr.it/FFV8…